Introduction to Raman Spectroscopy
Raman scattering is the inelastic scattering of light and is a result of molecular vibrations. The light interacts with the molecule and distorts the electronic cloud around the nuclei. This distortion results in polarization of the molecule and forms a short-lived state known as ‘virtual state’. The photon is re-radiated as this state is unstable. Raman spectroscopy involves the measurement of the energies of these re-radiated photons. It is a vibrational spectroscopy technique that can provide a spectral ‘fingerprint’ of the sample under investigation.
The energy changes detected in vibrational spectroscopy are those that cause nuclear motion. Photons are scattered with very small energy changes if only the electronic cloud distortion is involved. This is the cause of Rayleigh scattering which is the elastic scattering of light and is the dominant process. However, if a nuclear motion is involved, there is either an energy transfer from incident photon to the molecule or from the molecule to the scattered photon. Hence the scattered photon may have lower or higher energy than the incident photon. The former process is termed as Stokes Raman scattering and the latter as anti-Stokes Raman scattering (Figure 1). The molecule should be in a higher energy state to generate anti-Stokes Raman photon and it may be caused by thermal excitation, governed by Boltzmann distribution. The anti-Stokes Raman scattering is substantially weaker than the Stokes Raman scattering but has the advantage that it is less affected by the luminescence background.
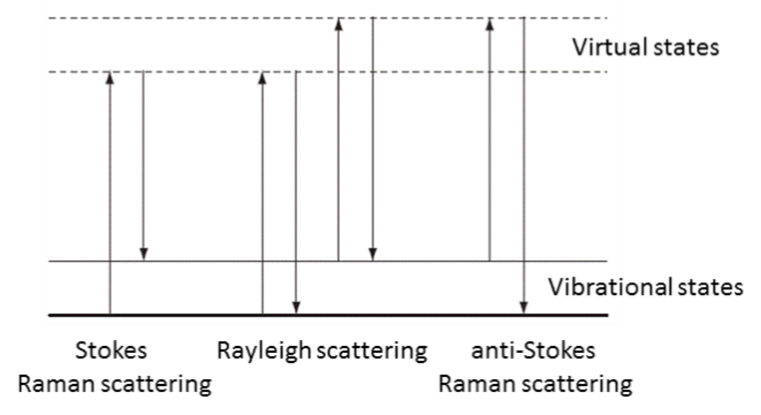
Figure 1: Energy diagram showing the Rayleigh and Raman scattering processes
Instrumentation
In a commercial Raman spectroscopy instrument, monochromatic laser light is directed onto the sample using optical elements and the scattered light collected and focused either on a collection fiber bundle (Figure 2) or on the slit of a spectrometer. A band pass filter is used to ‘clean’ incident laser light while a notch or an edge filter is used to block the dominant scattered laser light. The collected light is then dispersed in the spectrometer using a diffractive optical element and detected on a charged coupled device (CCD).
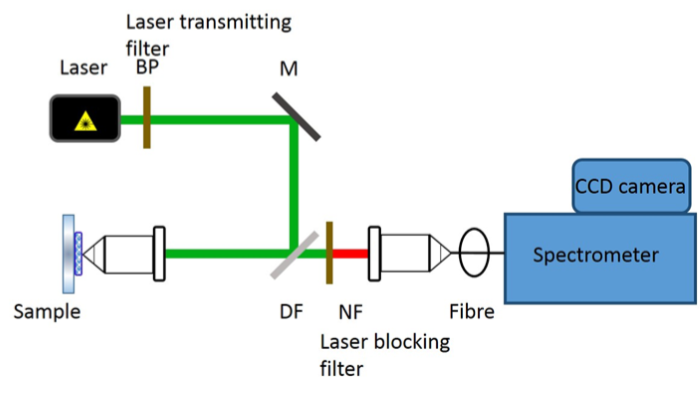
Figure 2: Schematic of a confocal Raman instrument
The choice of laser wavelength is very important in biomedical Raman spectroscopy applications. The reduced scattering coefficient generally decreases as we move from visible to near infrared (NIR) wavelengths. Light of visible wavelengths is also absorbed by tissue constituents. This results in lower penetration depth in tissue of the excitation light and also the generation of high fluorescence background in the acquired Raman spectra, affecting the quality of Raman signal. NIR light is weakly absorbed by tissue. Hence NIR laser wavelengths (for example 785 nm or 830 nm) for Raman excitation have the advantage of higher penetration depth and comparatively lower fluorescence background generation. Nevertheless, one should note that after 1064 nm, the absorption of light by water increases rapidly and this can again decrease the penetration depth of light in biological samples.
The fluorescence background in Raman spectra can be minimized using clever instrumentation, such as the use of hollow core optical fibers or photonic crystal fibers [1]. Also, by separating the excitation and collection arms of the Raman instrument it is possible to collect light from a localized region of interest [2], minimizing the luminescence background and increasing the Raman signal to noise ratio. Shifted Excitation Raman Difference Spectroscopy (SERDS), where Raman excitation is performed using lasers with slightly varying wavelengths, can provide elimination of fluorescence background for simple compounds. But, biological tissue consists of numerous fluorophores and such techniques are not useful for fluorescence background rejection. It is a common practice in the field of Raman spectroscopy to fit a polynomial to the Raman spectrum and subtract it in order to get rid of the fluorescence background. This method can help in a better qualitative visualization of the Raman peaks but does not help in quantitative prediction of bioanalytes. There is always a risk of introducing spurious background. Fluorescence background contains important information about the sample under investigation and it is recommended to utilize this information using multivariate data analyses.
