Fluorescence suppression in Raman micro-spectroscopy using 830 nm laser
Raman spectroscopy is a non-destructive and non-contact technique for analysis of a wide range of materialsing from graphene to biological cells. Due to the intrinsic properties of probed materials, the choice of laser excitation wavelength has a direct impact on the reliability and sensitivity of measured Raman signals. As highlight in the previous Application Note (Dual wavelength Raman Spectroscopy), the laser wavelength used will directly affect the Raman cross-section of probed molecules, the spatial resolution of resulting Raman images, detector sensitivity, and background fluorescence signals. In this application note, we focus on the degree of background fluorescence suppression using 785 nm and 830 nm near-infrared (NIR) laser wavelengths in Raman micro-spectroscopy.
The Raman spectra are obtained by using uRaman-Ci microscope system equipped with two separate NIR modules at 785 and 830 nm, respectively. The maximum output laser power for both modules is 100 mW. We use the same detector on both modules with the spectrometer ranging from 780 – 1100 nm for fair comparison. The test samples are crude palm oil obtained from customer and Panadol pill bought from local pharmacy.
Results and discussion
Crude palm oil exhibits a characteristic dark red color. This is due to the presence of carotenoids (α and β-carotene), which give rise to a very strong background fluorescence. It is generally recommended to use laser wavelength of > 785 nm and above for using Raman spectroscopy to study the compositions of the crude palm oil to minimize the fluorescence background.
In our demonstration, we load the crude palm oil solution into a plastic cuvette attached to the Technospex’s cuvette holder. The Raman spectrum is collected directly from the cuvette at 785 and 830 nm, respectively, and at acquisition time of 2 s. 10 spectra are collected for each wavelength, and the averaged spectra from 785 and 830 nm are compared, especially in terms of the degree of fluorescence suppression (Figure 1).
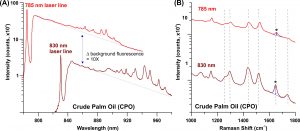
Figure 1. (A) Raman spectrum obtained from the two lasers in wavelength (nm) and (B) Raman spectrum of crude palm oil from 1200 to 1800 cm-1.
From Figure 1, it is obvious that the background fluorescence from the crude palm oil is lower when using 830 nm than 785 nm. The background fluorescence suppression is around 1 order of magnitude in 830nm spectrum (Figure 1A). This is because 830 nm laser excites at the tail of background fluorescence wavelengths of palm oil, and hence suppressing the fluorescence excitation of crude palm oil. Therefore, 830 nm Raman spectrum has a much lower fluorescence background as compared to 785 nm’s.
Raman spectra at the range of 1200 to 1800 cm-1 further are highlighted in Figure 1B. The signal to background ratio (S/B) in the Raman spectrum taken from 830 nm laser wavelength is much higher than 785 nm laser wavelength. Using the 1645 cm-1 peak for comparison, the S/B830 is 1.7, which is much higher than that of S/B785 (1.2). Moreover, the region of 1200 – 1800 cm-1 contains important Raman vibration modes in crude palm oil, such as CH2 (1302 cm-1 and 1443 cm-1), C=C (1276 cm-1 and 1655 cm-1), C=O (1747 cm-1). This vibration information can be directly correlated to the presence of saturated and unsaturated fats in the crude palm oil.
The next example is the Raman measurements of pink Panadol pill (main active ingredient is Paracetamol) using both NIR modules. The pink color pigment and scattering from the sample are the main source of the background fluorescence in its Raman measurement.
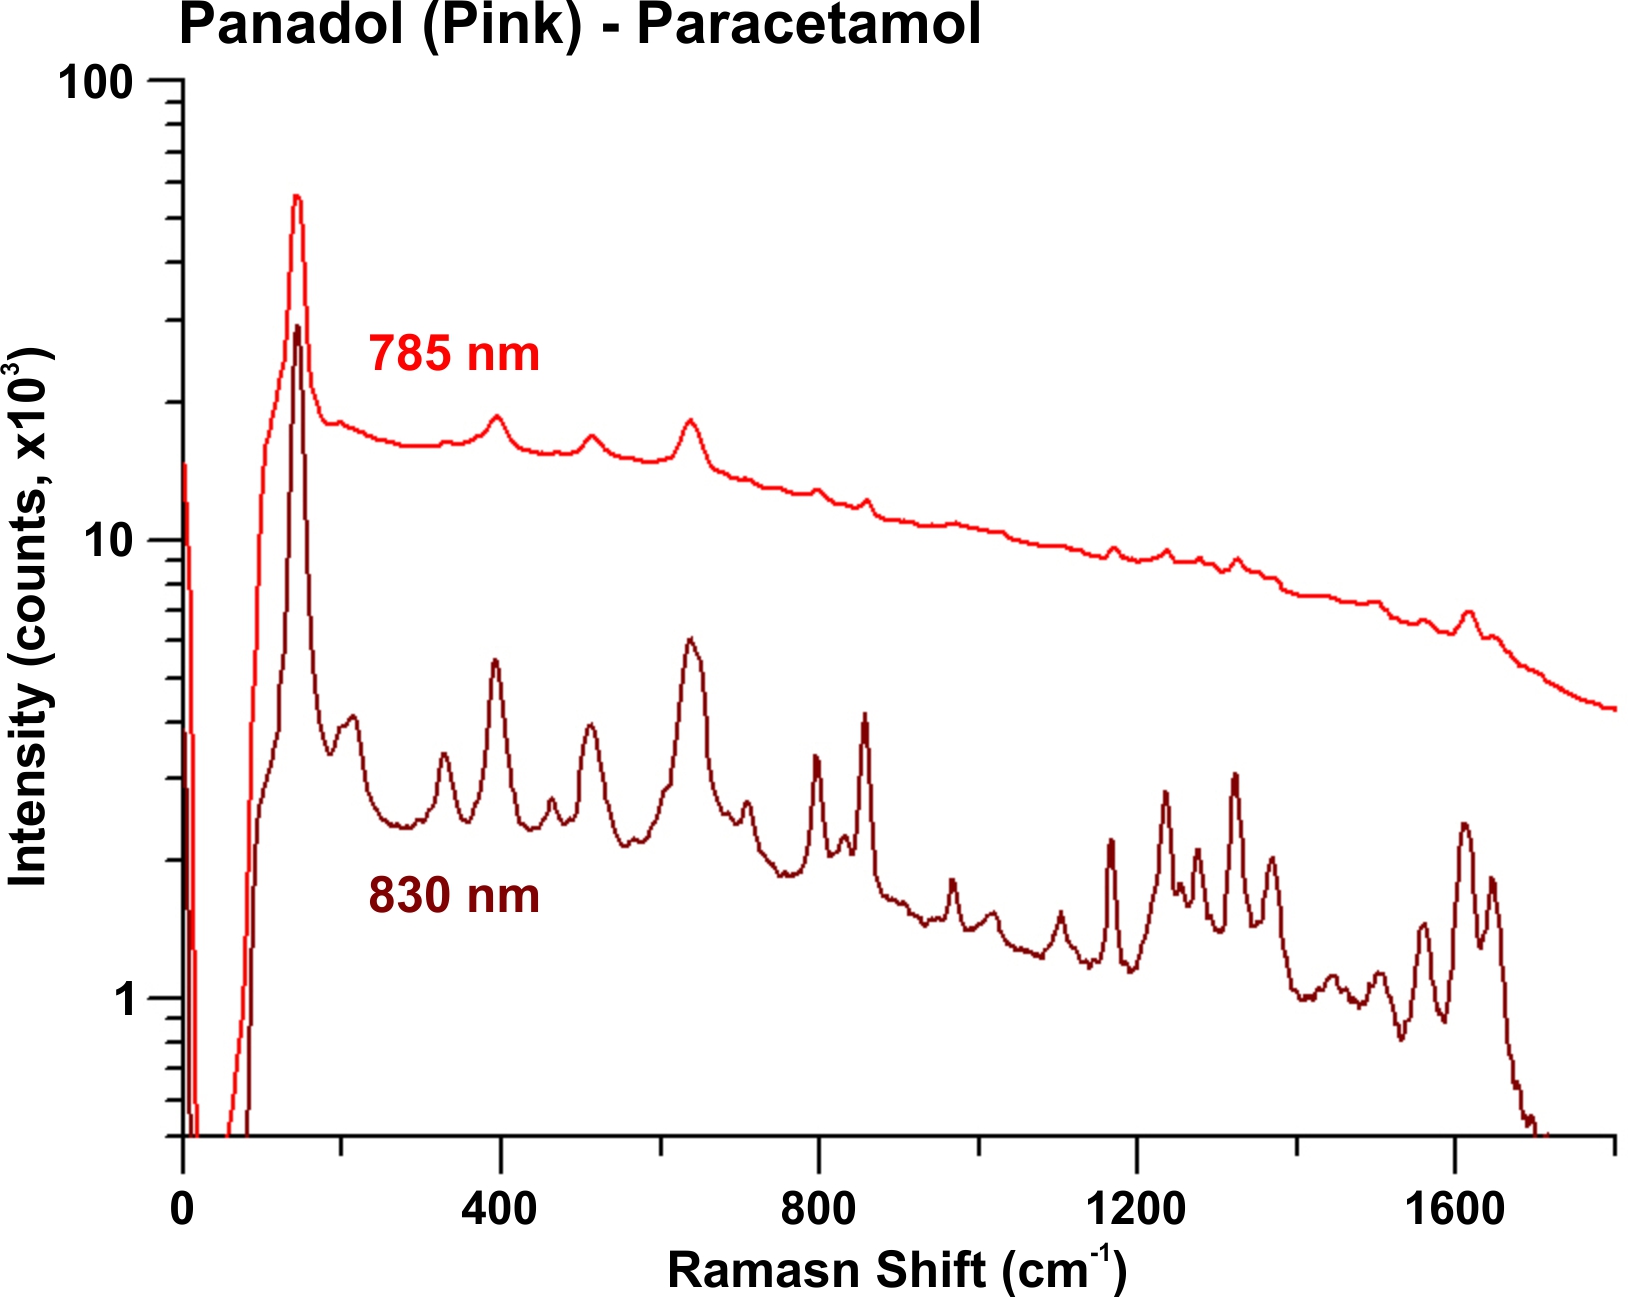
Figure 2. Raman spectrum of pink Panadol obtained from the two lasers in wavelength (nm).
Figure 2 clearly shows the Raman spectrum taken with 830 nm laser wavelength presents a much sharper and prominent Raman peaks as compared to that of 785 nm’s. Moreover, the strong suppression in background fluorescence in 830 nm gives rise to very good signal-to-background ratio. As a result, the Raman spectroscopy using 830 nm laser wavelength is very promising in pharmaceutical application. In particular, it can be used to construct a spectral library of various pills for anti-counterfeiting applications.
Technical Comparison between 785 nm and 830 nm lasers
As a rule of thumb, the higher the laser wavelength used in Raman spectroscopy, the better the degree of auto fluorescence suppression. Unfortunately, the disadvantage is weaker Raman signal obtained. For comparison, we tabulate the parameters that are affected when using different laser excitation wavelengths, including (1) Raman scattering cross-section, (2) spatial resolution of Raman images, (3) detector sensitivity (same detector in this study) and (4) background fluorescence signals, in Table 1.
Table 1. List of parameters that influence the Raman signal
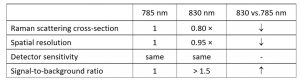
When we compare the Raman scattering cross-section and spatial resolution between 785 nm and 830 nm lasers, the 830 nm laser yields a 20% lower scattering cross-section and negligible difference in spatial resolution (x- and y- direction). However, the improvement in signal-to-background ratio is much higher using 830 nm laser. In overall, it is worthwhile to use 830 nm to measure samples with strong fluorescence background without compromising other parameters. One thing to do is that spectral range. Using silicon-based CCD detector, the 785 nm can capture spectral range up to 3200 cm-1, whereas 830 nm laser can only capture spectral range up to 2400 cm-1. If > 2400 cm-1 spectral range is necessary, and the samples contain strong fluorescence background, it is advisable to use 830 nm with indium gallium arsenide (InGaAs)-based CCD detector.
