Reflectance hyperspectral mapping with uSight-2000 potential for document forensic analysis
Forensic investigation is a fascinating subject popularized by crime movies and drama series. For instance, the movie “Catch Me If You Can” is based on the life of a cheque fraud. Unfortunately, cheque fraud and document forgery in general are still ubiquitous and happens more regularly than we know today.
In Technospex, we demonstrated that our uSight-2000 can be used as a forensic tool to determine and differentiate the optical properties pen inks, with high spatial accuracy (size ≤ 1 mm). We first performed a hyperspectral imaging of a large area of a handwriting “*” with a uSight -2000 setup on a Nikon-Ci microscope and a motorized stage. The “*” is written using four different pens. Using the reflectance colour measurement capability of uSight-2000, the reflectance of four types of pen inks are spectrally identified, where the experimentally obtained spectra are then statistically identified and differentiated using hierarchical cluster analysis (HCA).
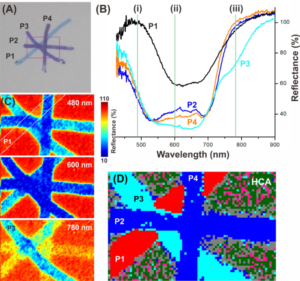
Figure 1 Reflectance map taken from the sketch (A). Reflectance spectrum (B) and map (C) at different wavelengths, i.e. 480, 600, 780 nm, respectively. (D) 6 clusters HCA map.
The details of our measurements are as follow. A handwriting of “*” with simple 4 lines that crossed each other was written using 4 different pens (Figure 1A). Pen 1 (P1) has a lighter colour ink but the colour of 3 other pens (P2 – P4) look very similar and visually indistinguishable. The reflectance spectrum (Figure 1B) of the “*” was first performed to determine the optical fingerprint of the pens. Typically, the inks of P2 – P4 exhibit sharp drop in reflectance from 400 nm onwards, and reach around plateau off at ~520 nm. Whereas the ink of P1 exhibits high reflectance from 400 – 500 nm, and experiences onset of moderate reflectance drop at 500 nm, which plateau off at 600 nm (Figure 1B).
In all cases, the reflectance experience an increase from 700 nm onwards and reach saturation at 900 nm. For blue ink from pen 3 (P3) has lower reflectance around 780 nm as compared to the rests.
Out of the 4 pens, 2 pens (i.e. P1, P3) exhibit very distinct reflectance spectra that can easily have detected spectrally. The colour map in Figure 1C clearly indicates the anomaly within the “*”. For instance, at 480 nm colour map, the line written by light blue colour pen (P1) is absent on the map. At 600 nm, all the inks are present, albeit with very low reflectance. At 780 nm, blue ink from pen 3 (P3) is more obvious on the map as compared to the rests.
We then perform Hierarchical Cluster Analysis (HCA) analysis (courtesy of “CytoSpec”) on the reflectance colour map (Figure 1D). Of the 6 clusters identified by HCA in our reflectance colour map (Figure 1D), we classify them into 4 groups, i.e. background (1-3), Pen 1 in red (label 4), Pen 3 in cyan (label in 5) and Pen 2 and Pen 4 in blue (label in 6). Pen 2 and Pen 4 exhibit similar characteristic, which cannot be distinguished by HCA. This is not unusual because some manufacturers use the same ink supplier, or the same manufacturers markets the same pens under different brands.
Lastly, we used pen 2 and pen 3 to draw a line as shown in Figure 2(A). Visually, it looks like a straight line written using a single pen. However, reflectance maps (Figure 2B) from 480, 600 and 780 nm clearly reveal the two dots at both ends are written using a different pen from the connecting line. The HCA map in Figure 2C clearly support this observation, which show two distinct clusters (P2 and P3 clusters). From this experiment, we can confidently conclude that the two dots are written using pen 3 and the connecting line from pen 2. Without carefully look at the reflectance, one can easily overlook the gimmick trick of forgery. The task of differentiating minor differences in handwriting is also made easy by combining the reflectance colour measurements and statistical analysis (HCA in this case).
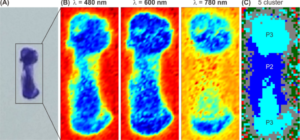
Figure 2 (A) hand writing image. (B) Reflectance map at different wavelength, i.e. 480, 600, 780 nm, respectively. (C) HCA cluster image of the reflectance map.
Acknowledgement
We thank Dr. Peter Lasch, the creator of CytoSpec to provide evaluation copy of CytoSpec 2.00.04 for HCA analysis performed in this application note.
